Traceability
Inside a project, every data layers transform input data into a new one. These input/output links can be represented through a directed acyclic graph (DAG). The traceability of those transformation is available from the main project view at the granularity of whole layers. See below to see an example of a project data graph:
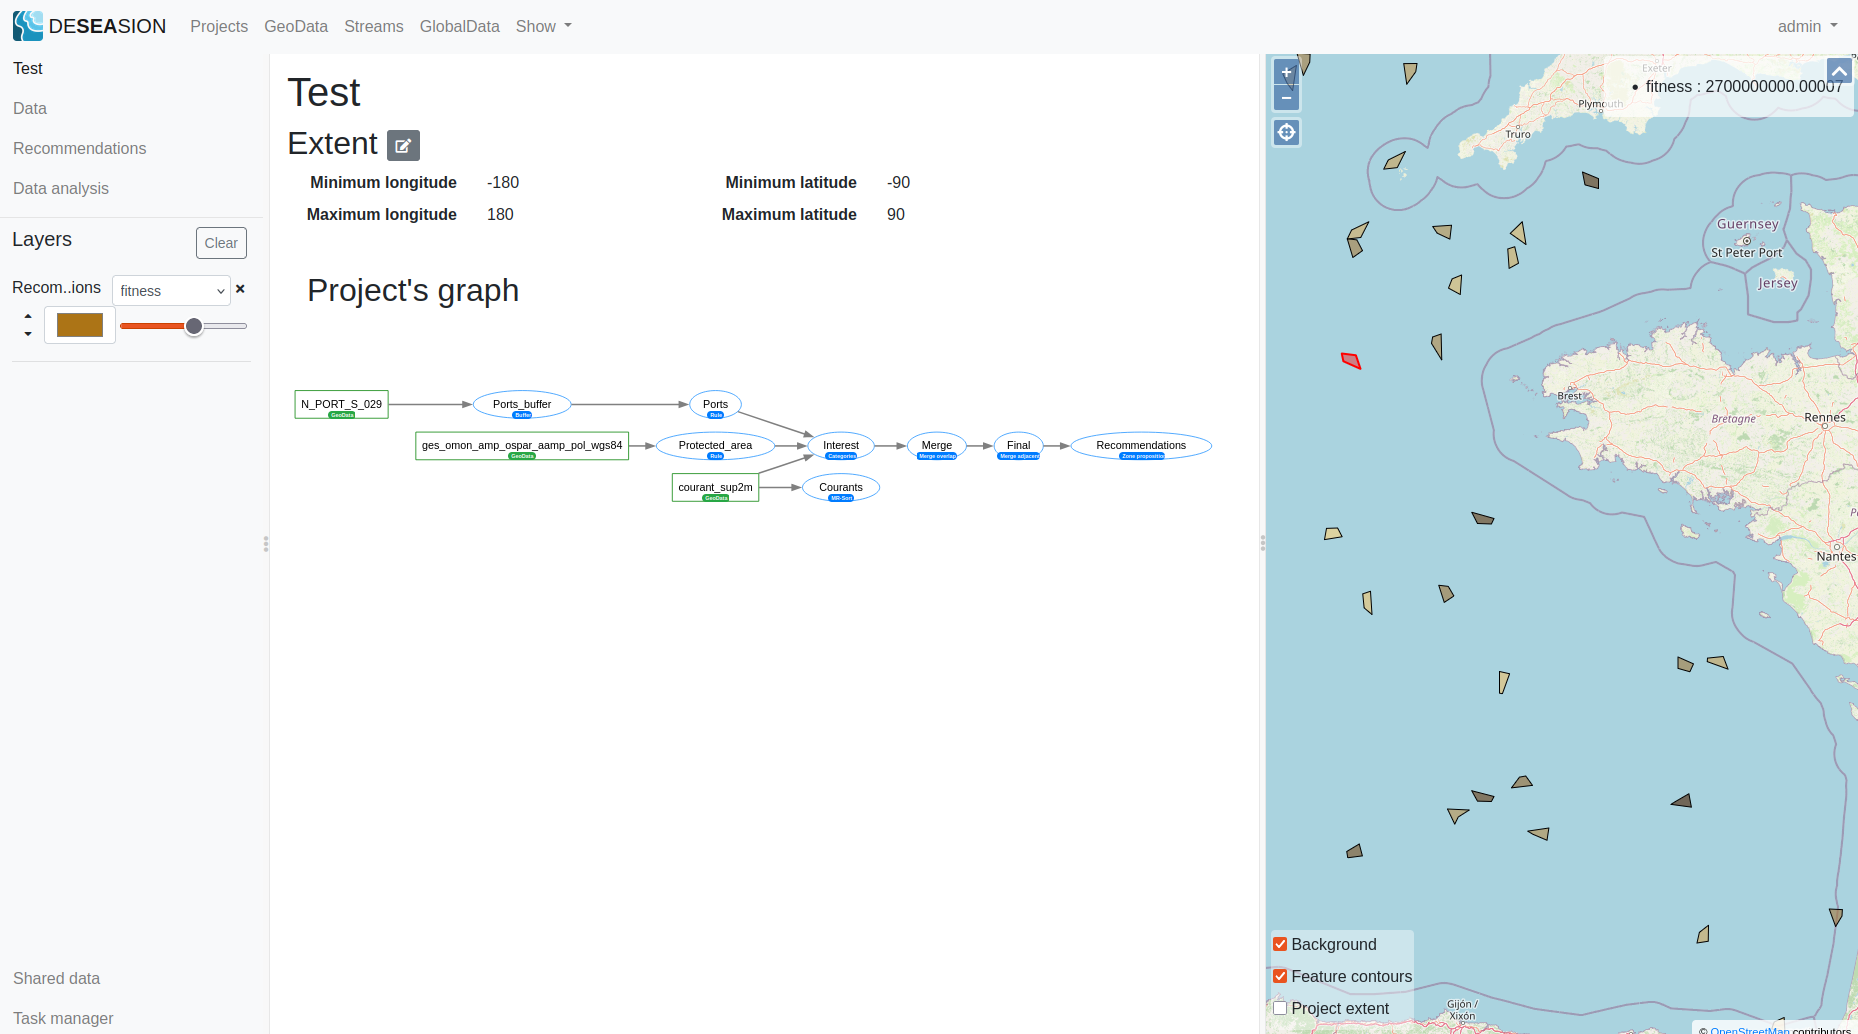
This graph shows a node per data layer (each node has a shape, a colour, the layer name and a badge). The square nodes are the project inputs (data streams, uploaded geo data, global data), they can be easily differentiated by their colour and badge. The ellipsis nodes are the data generators transforming the data, their badges are blue and indicate their active processing model. The currently selected layer (if any) has its area coloured in light-yellow. Whenever you see a node with a double border, it means it is outdated (i.e either never computed or computed earlier than its inputs).
Note
This data graph is interactive, will propose actions, links to layers and update whenever its state changes.
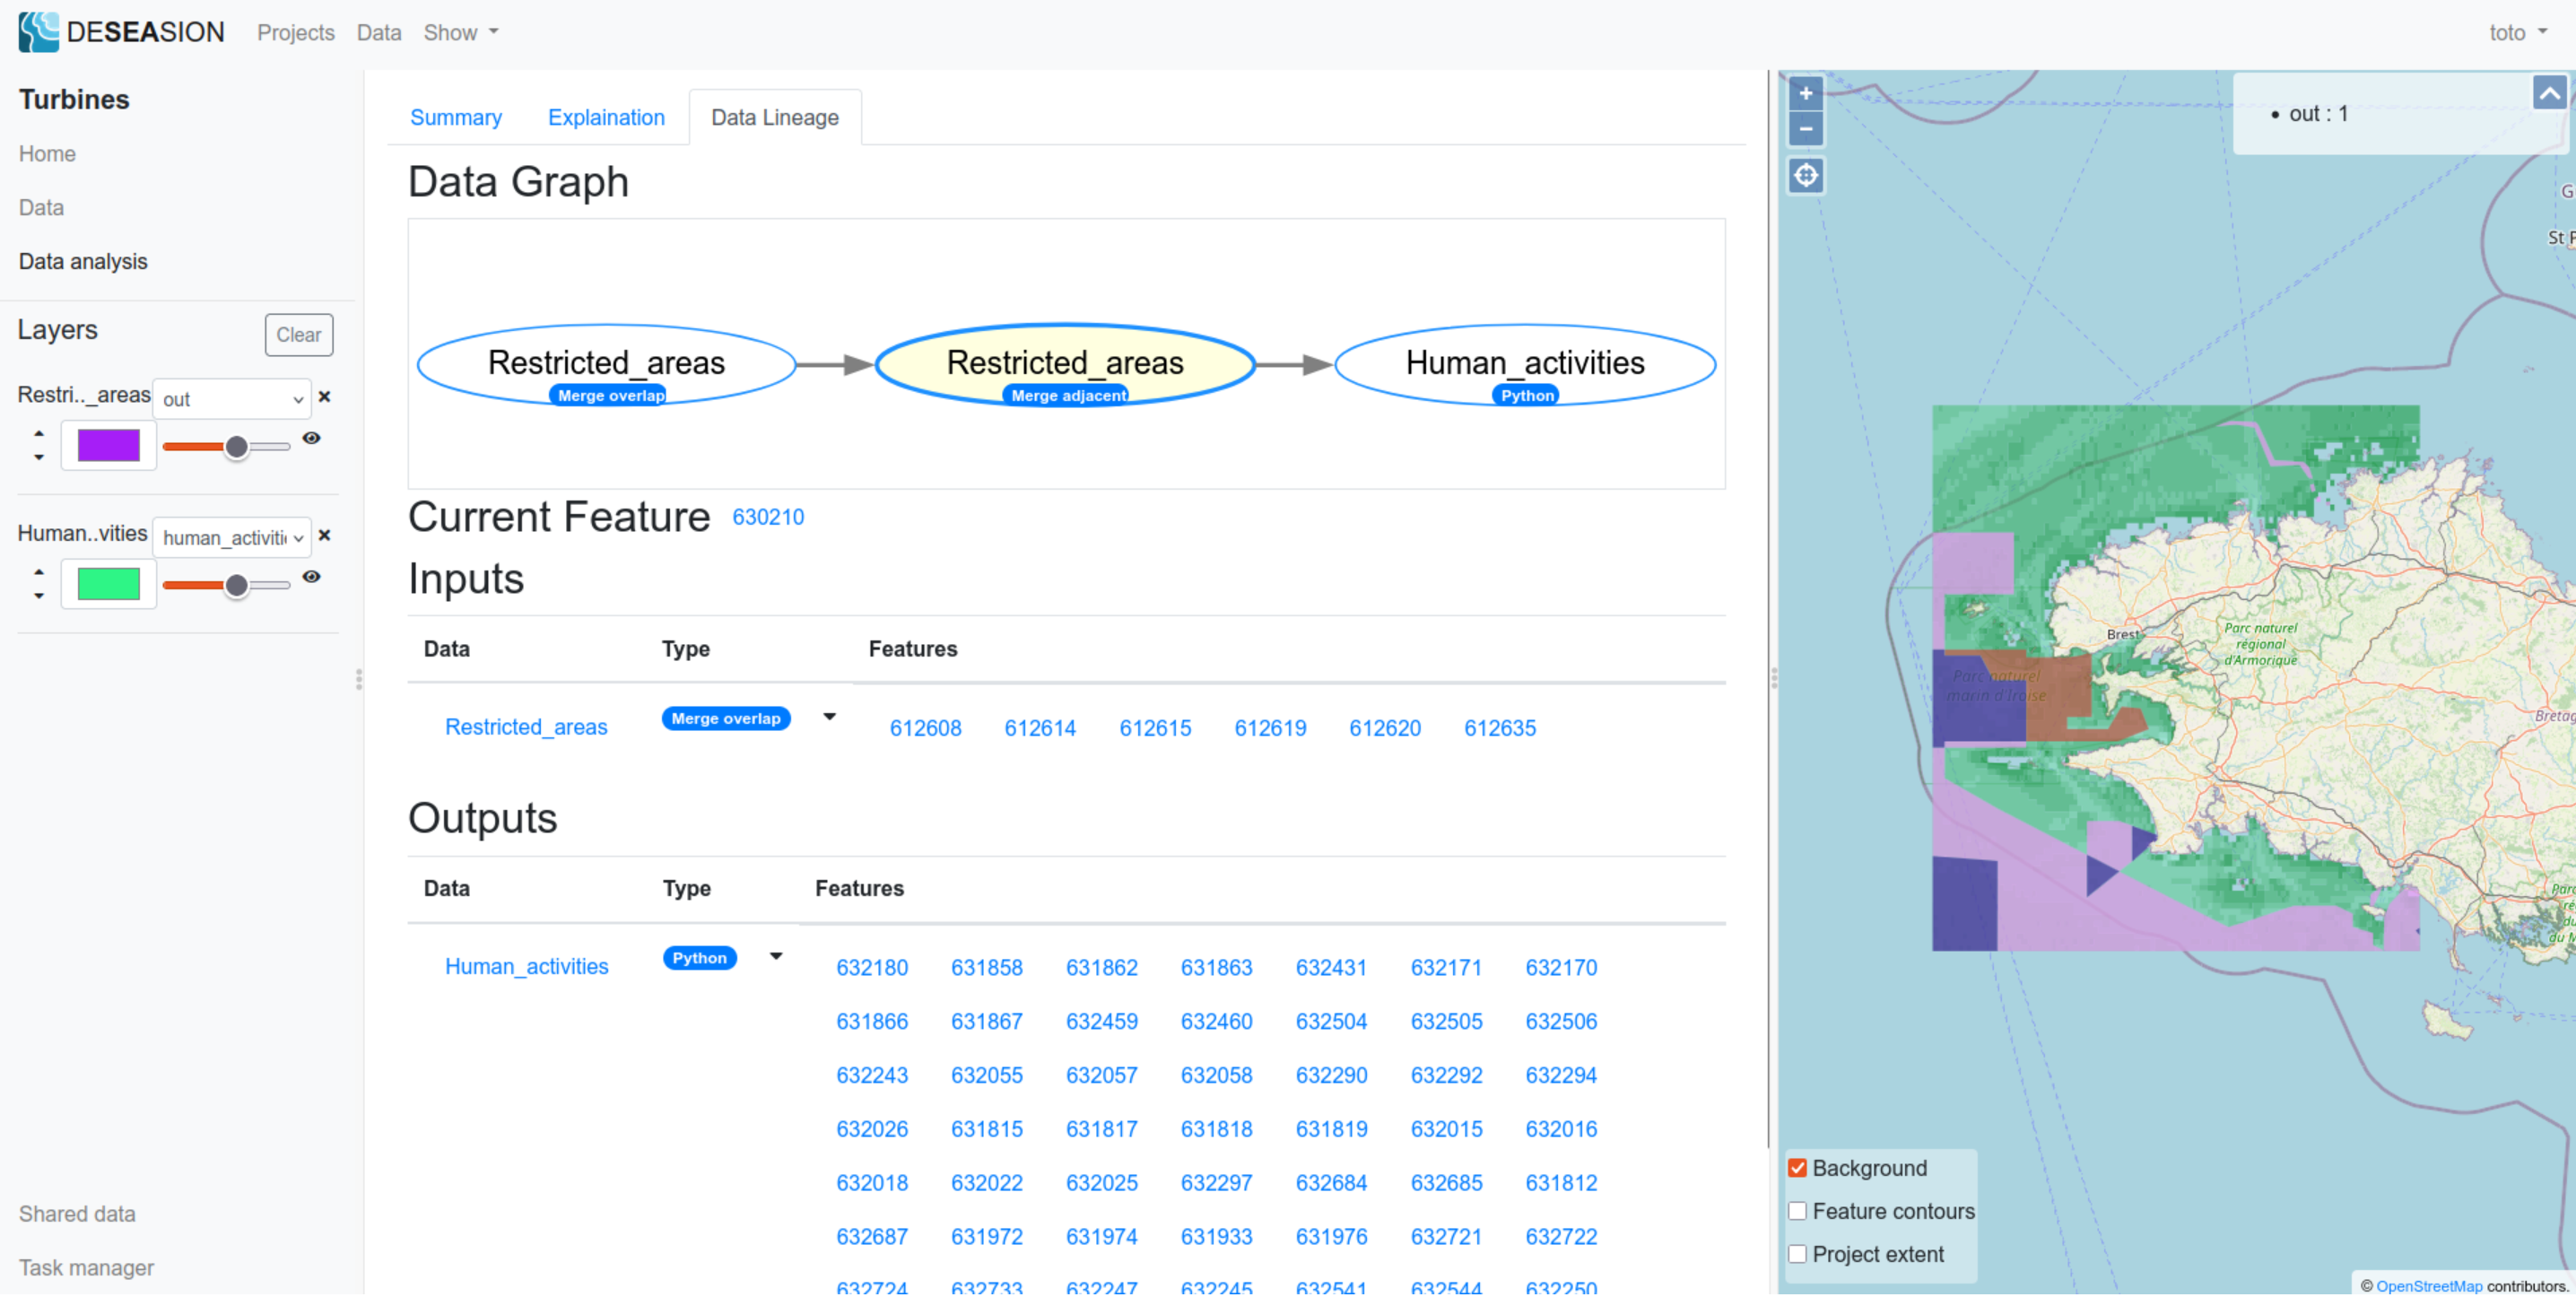
Furthermore, the tracability is also available at the feature granularity through the data lineage tab. This tab is available from the data analysis menu when inside a project. It appears whenever a feature is selected on the map, and is updated whenever this changes.
It shows the following information:
Relative data graph: shows the immediate inputs and outputs of the selected feature data layer
Current Feature: shows the current feature id (useful when navigating back and forth through the data lineage graph)
Inputs table: shows the layers used to compute the current feature (only the ones actually used to compute the feature, its values or geometry) Each input layer has an expandable view showing each individual feature used as inputs.
Outputs table: shows the layers using the current feature as input (only the ones actually using the feature, its values or geometry) Each output layer has an expandable view showing each individual feature using this feature.
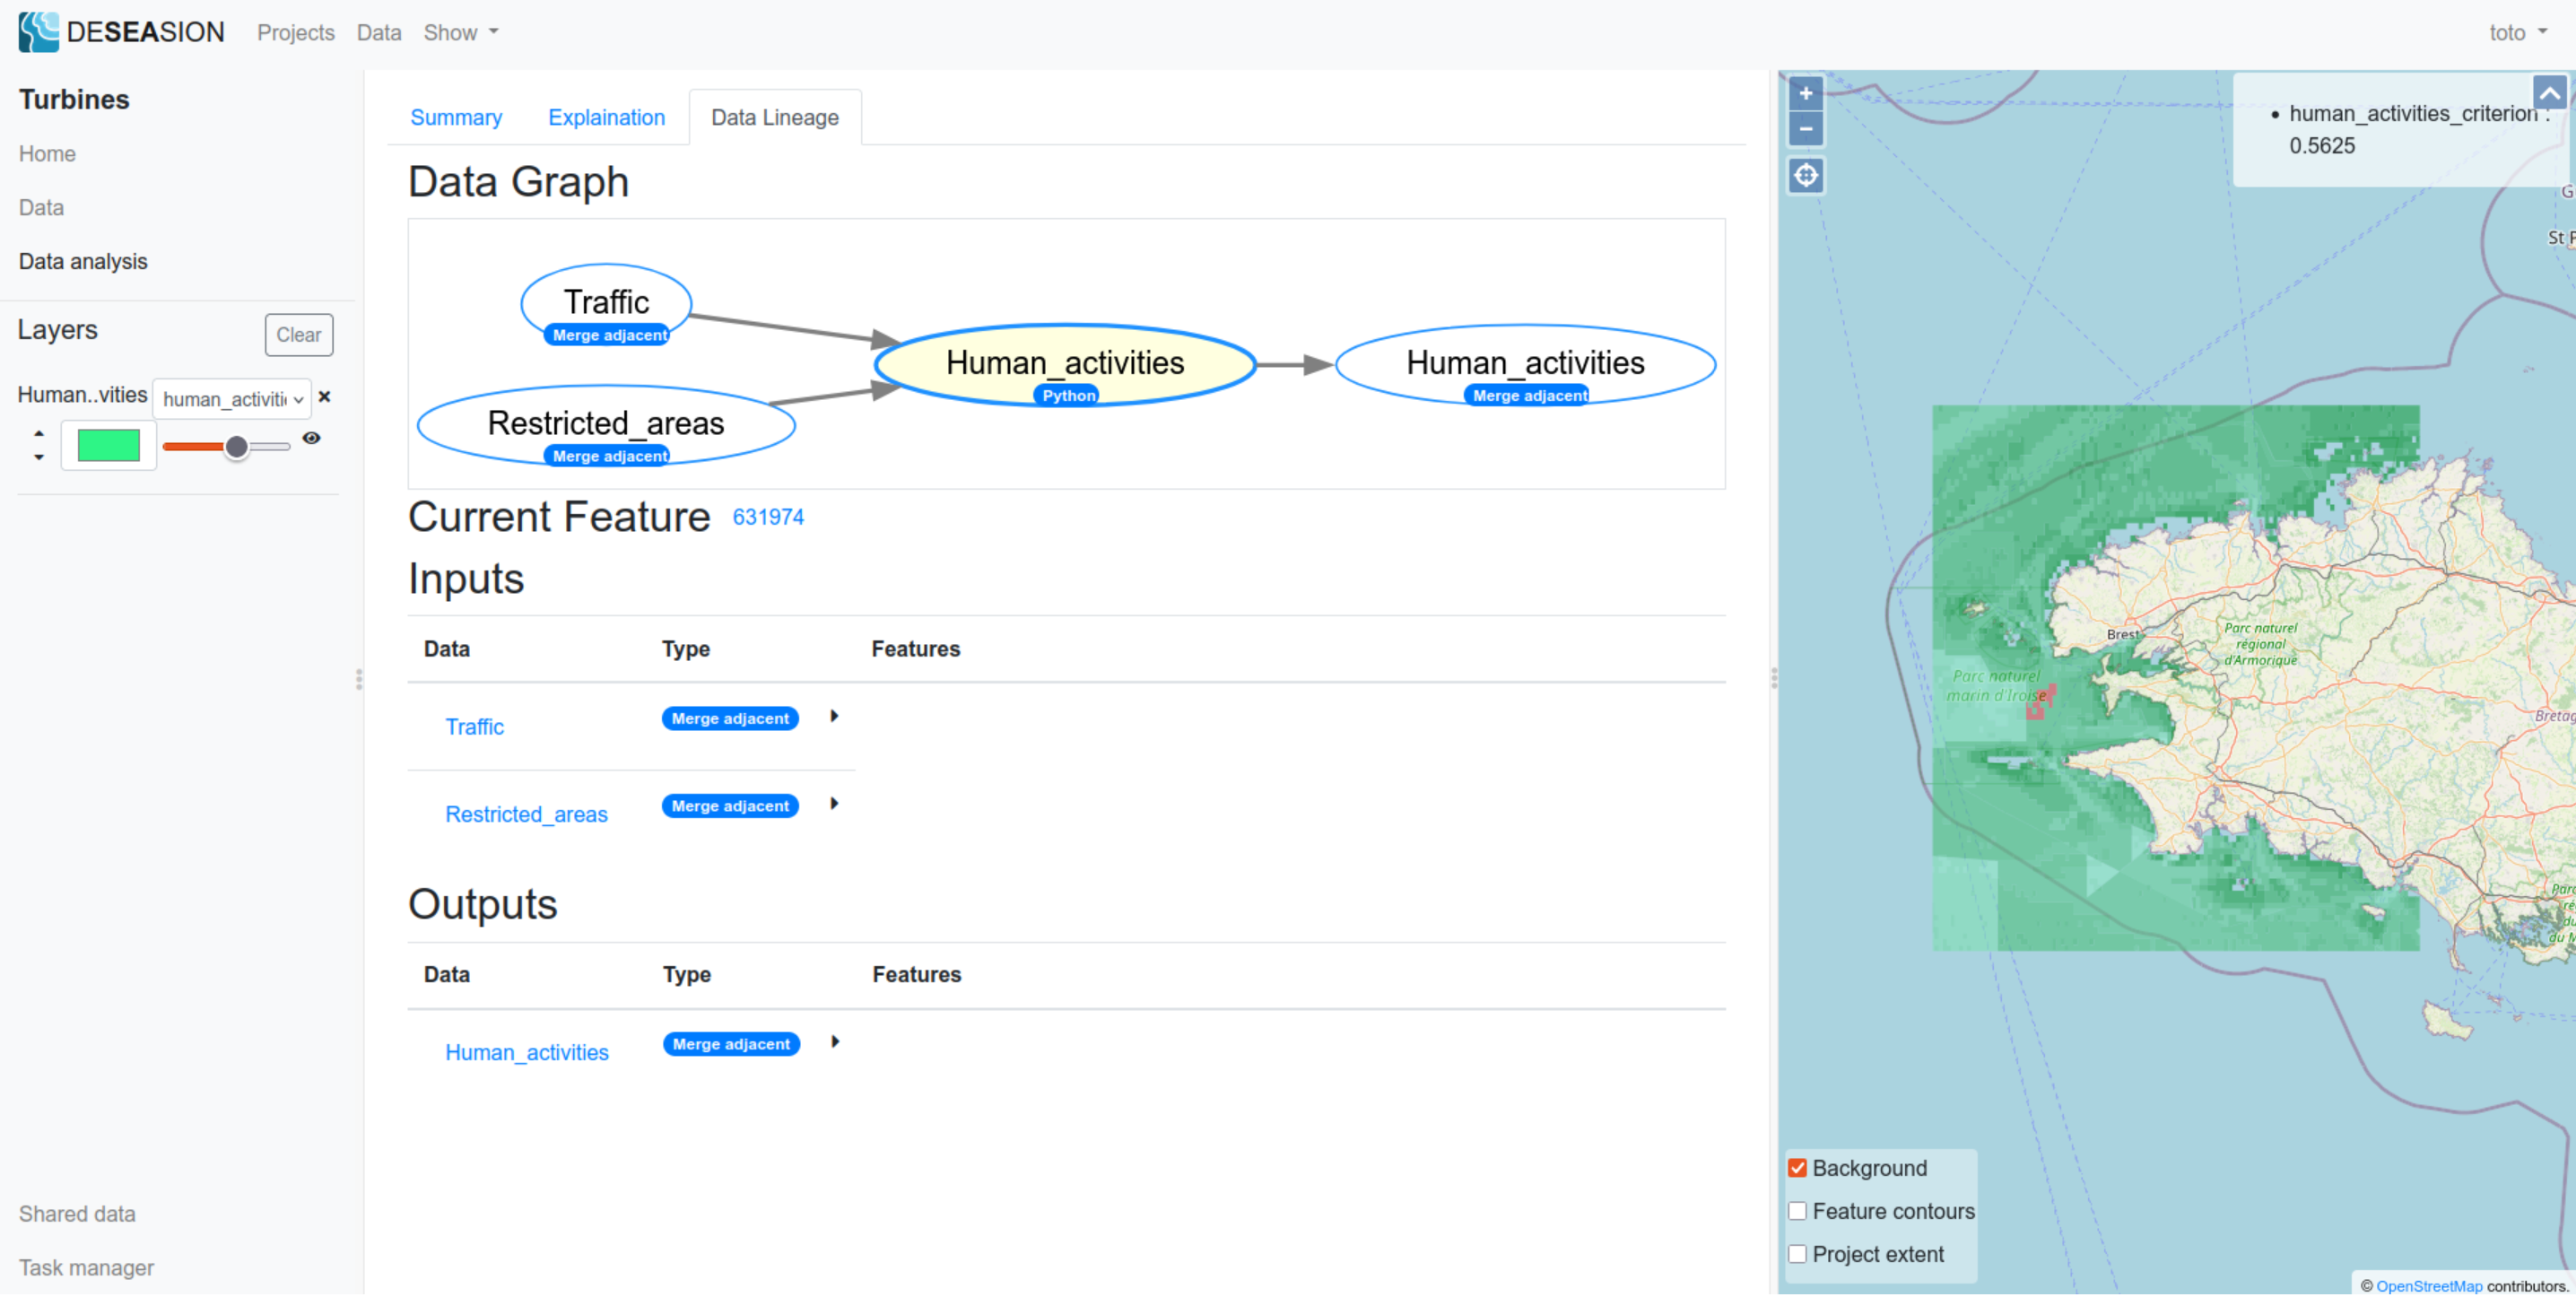
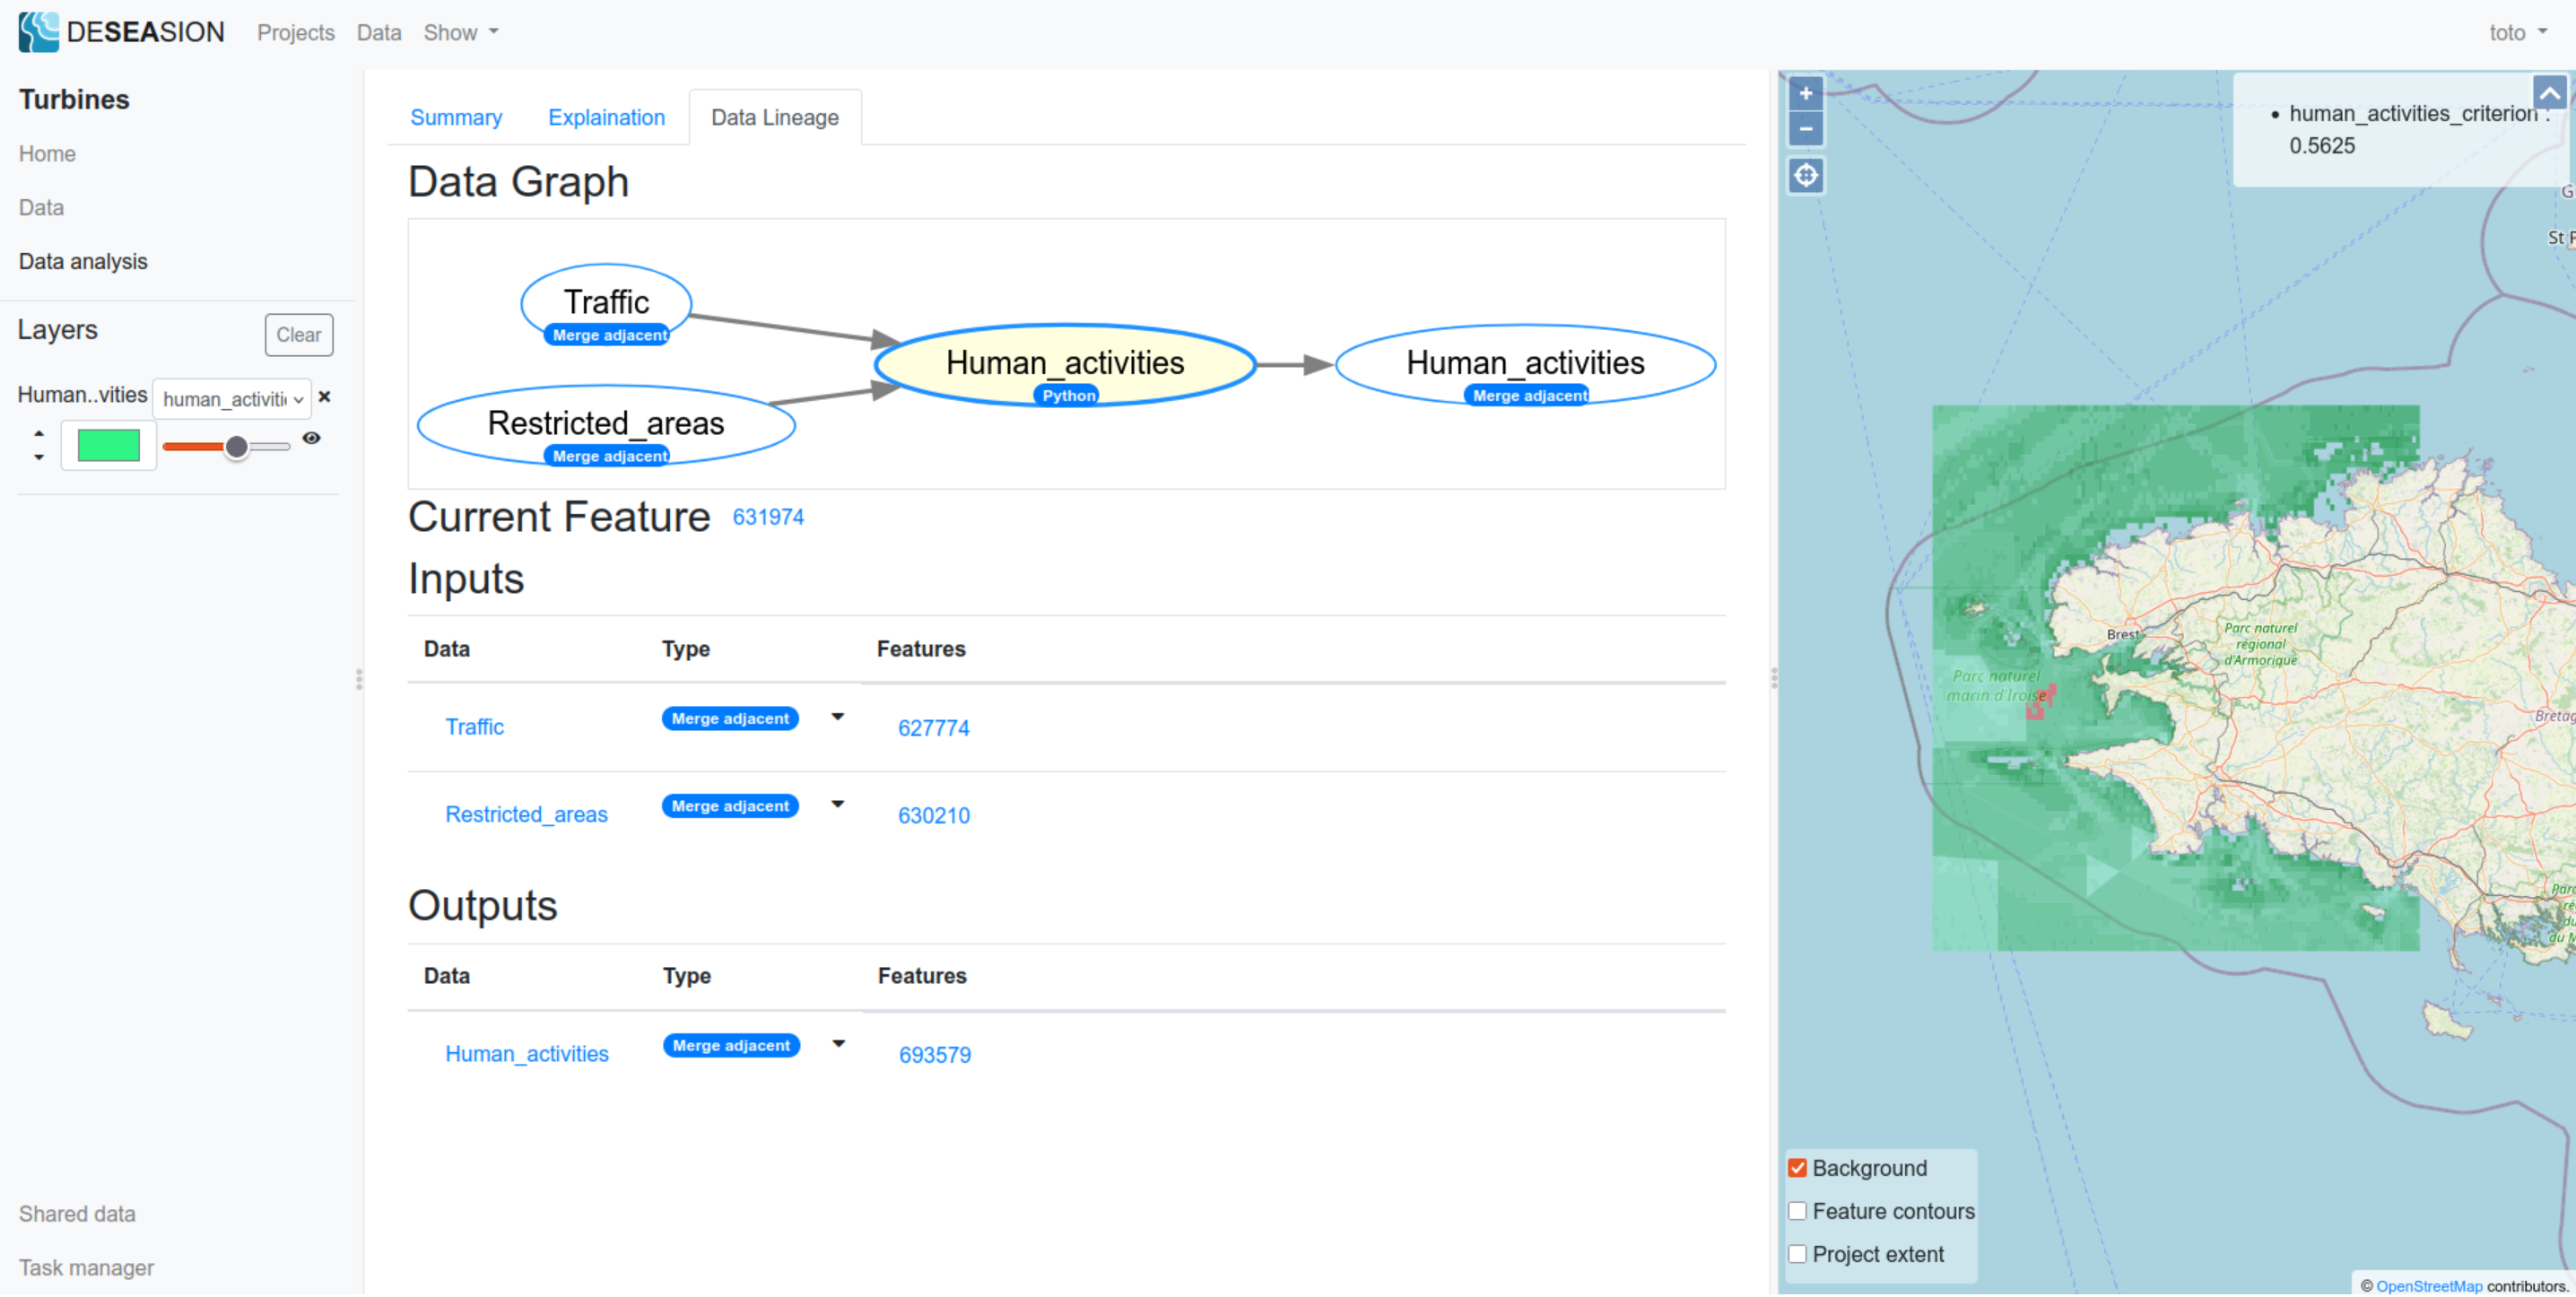
The data layers names can be used as links to view the layer information (its edition menu). Clicking on any feature id, be it an input or an output, will select this feature and show its data lineage. This allows you to travel back and forth through the data lineage graph of each feature.
When clicking on the Restricted_areas feature used as input in the above example, this updates the view thusly: